.9 miles is how long a lap is around Lake Eola in downtown Orlando Florida. The path initially started off as a road around the lake but now motorized vehicles are forbidden. Usually there are people walking and jogging and the only people on bicycles are members of the Orlando Police Department.
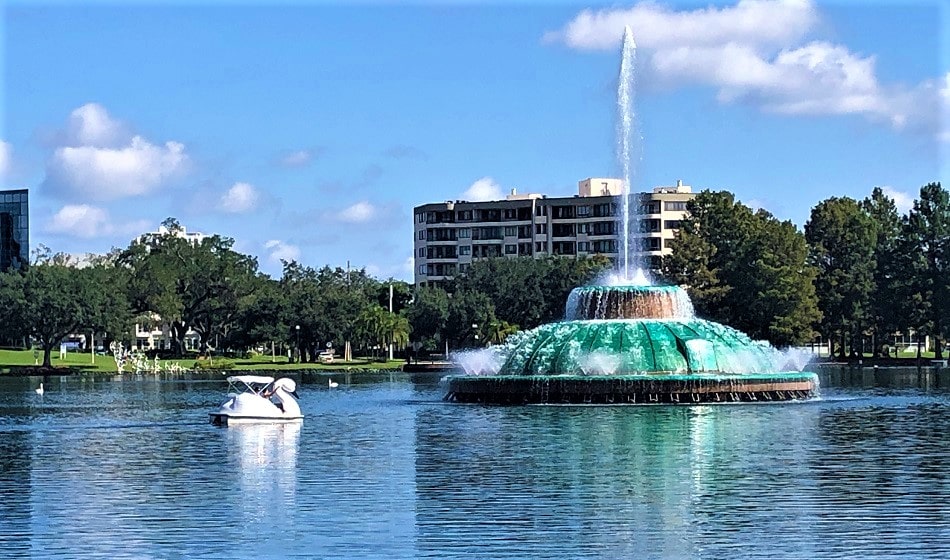
One of the best ways to view Orlando's skyline is on a beautiful day or evening for visitors to hit the walking trails around Lake Eola. This is especially true from the northern and eastern sides of the park. Another great way is a ride on one of the swan shaped paddle boats that you can rent next to the Walt Disney Amphitheater on the northwest corner of Lake Eola Park.
Renting a swan paddle boat can be done on just about any afternoon. The cost is $15 per person, up to 5 per swan boat, and the swan boats can hold up to 1,400 pounds. Most people who opt for renting the swan boats will head straight out to the amazing fountain.
Actually quite a few. None compare to the spectacular view of Orlando's skyline but there are some beautiful flower beds, a playground, many other birds inhabiting the park area plenty of live swans and ducks and other activities are scheduled each week. On Sunday the farmers market is held and usually other events are held simultaneously. Get out there and exercise, there are trails to be walked and lovely scenery to be enjoyed in downtown Orlando Florida.
Previous Article
Next Article


407-575-5392
Wendy Morris LLC
DBA Wendy Morris Realty
Licensed in the State of Florida
BK 3146762
16797 Broadwater Avenue
Winter Garden, Florida 34787